

Figures: General
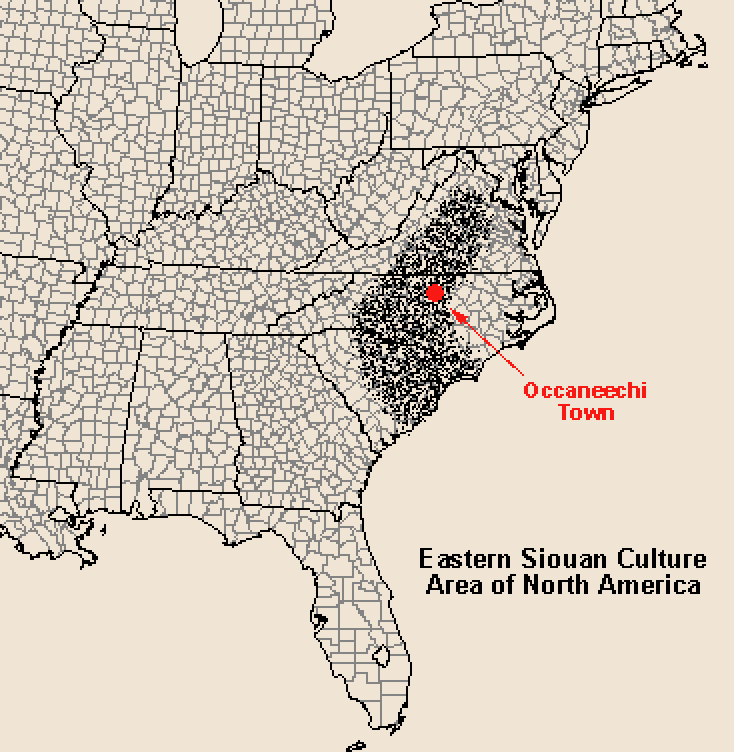
Figure 1. Distribution of Siouan-speaking peoples in eastern North America (based on Mooney 1894).
Figure 478. Map showing the Siouan Project study area.
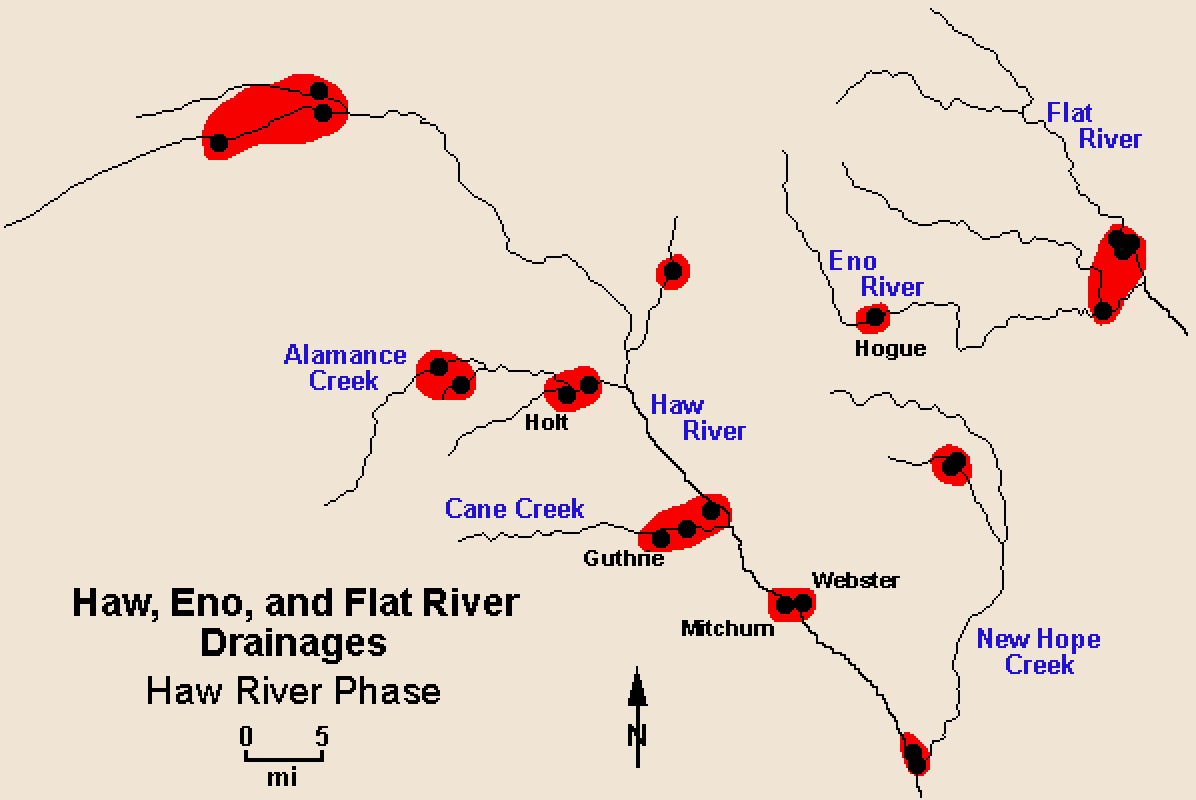
Figure 479. Distribution of Haw River phase sites (areas of suspected settlement concentration are shown in red).
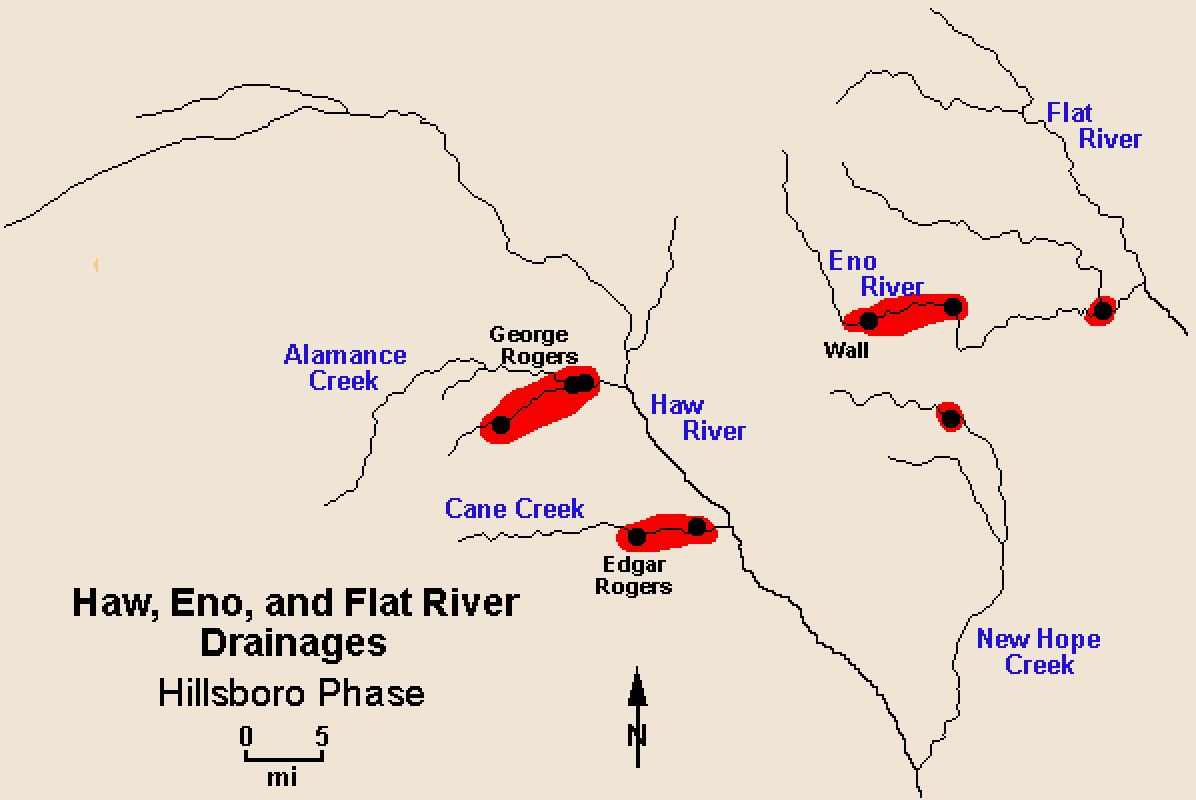
Figure 480. Distribution of Hillsboro phase sites (areas of suspected settlement concentration are shown in red).
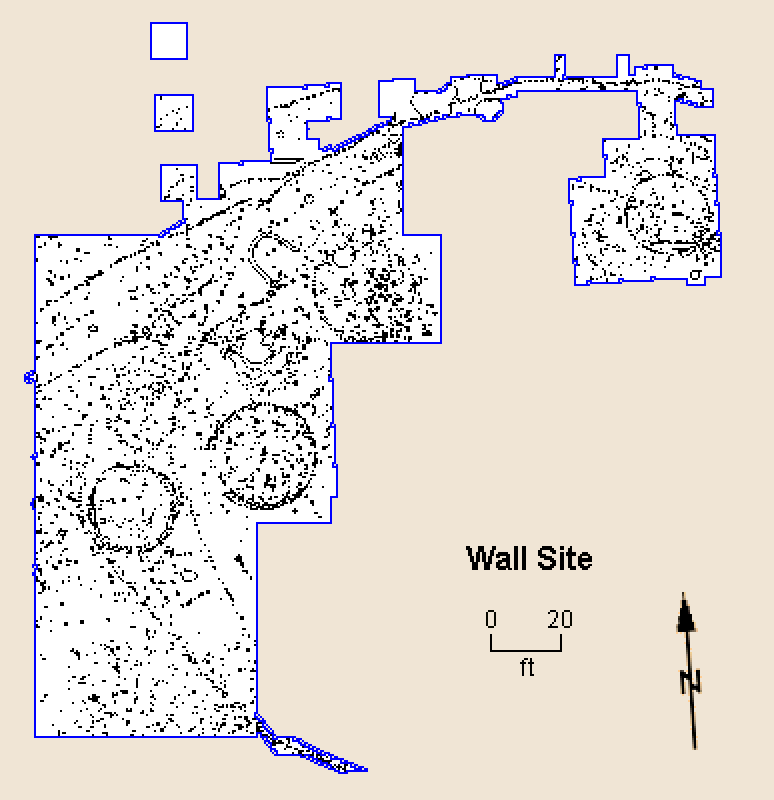
Figure 481. Excavation plan of the Wall site.
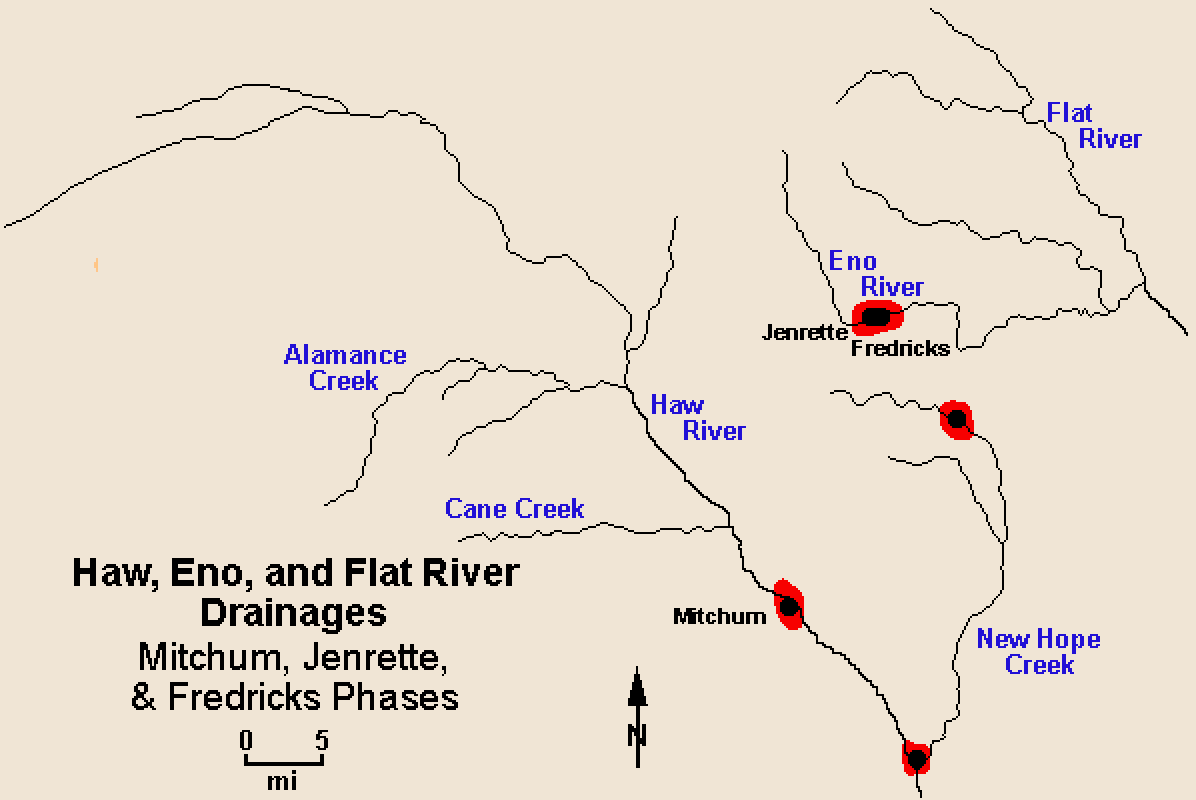
Figure 482. Distribution of Mitchum, Jenrette, and Fredricks phase sites (areas of suspected settlement concentration are shown in red).
Figure 483. Subrectangular house (measuring 17 ft by 22 ft) at the Mitchum site.
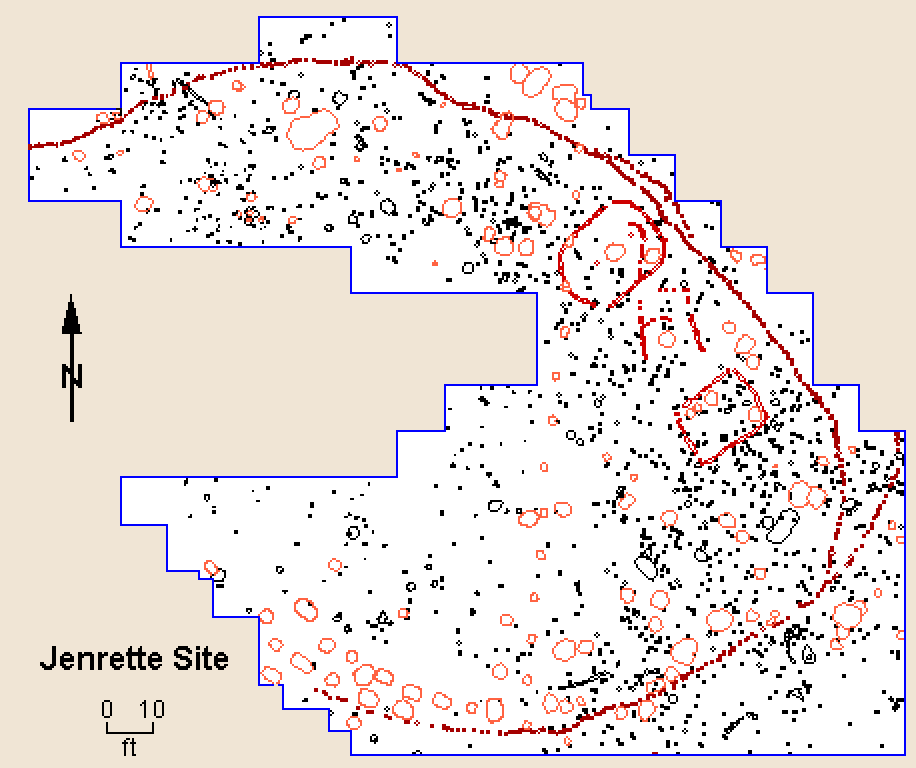
Figure 484. Partial excavation plan of the Jenrette site, 1989-1996.
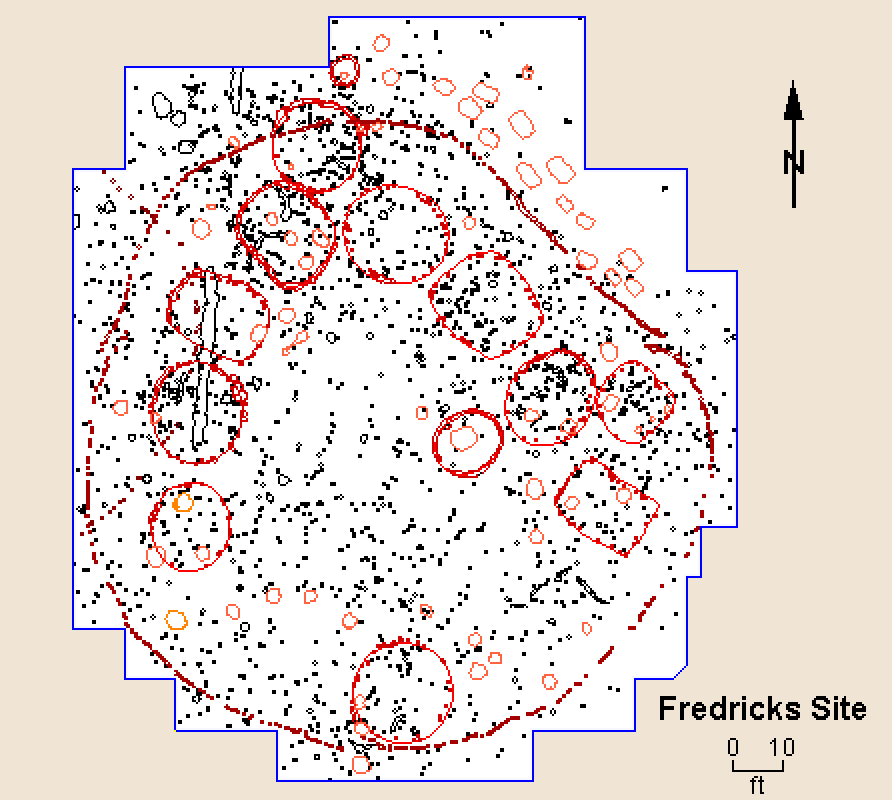
Figure 485. Excavation plan of the Fredricks site.
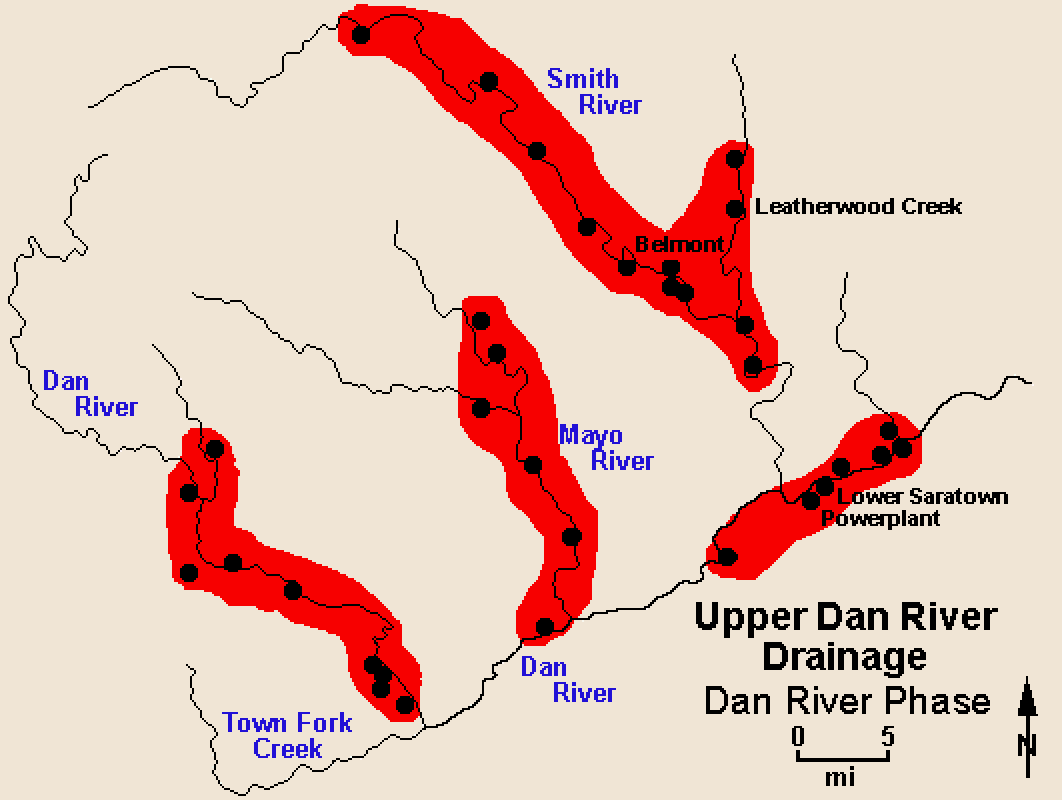
Figure 486. Distribution of Dan River phase sites (areas of suspected settlement concentration are shown in red).
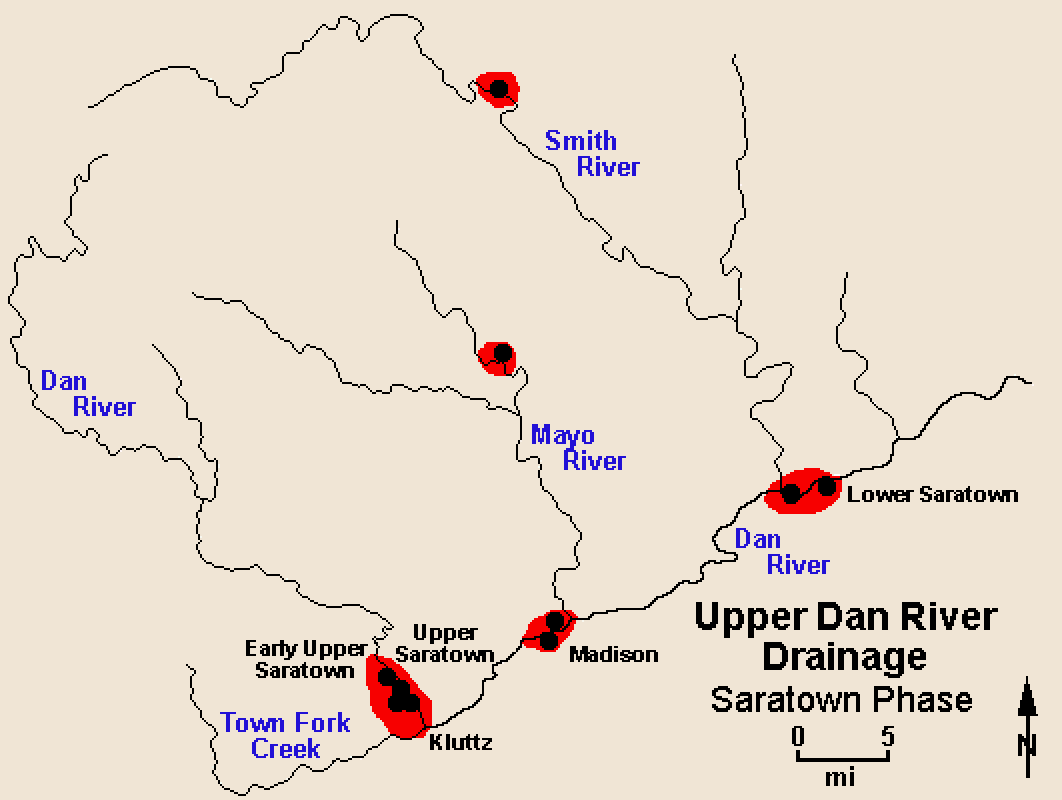
Figure 487. Distribution of Saratown phase sites (areas of suspected settlement concentration are shown in red).
Figure 488. Rebuilt house at Lower Saratown (the smaller house is 18 ft in diameter; the larger house measures 20 ft by 23 ft).
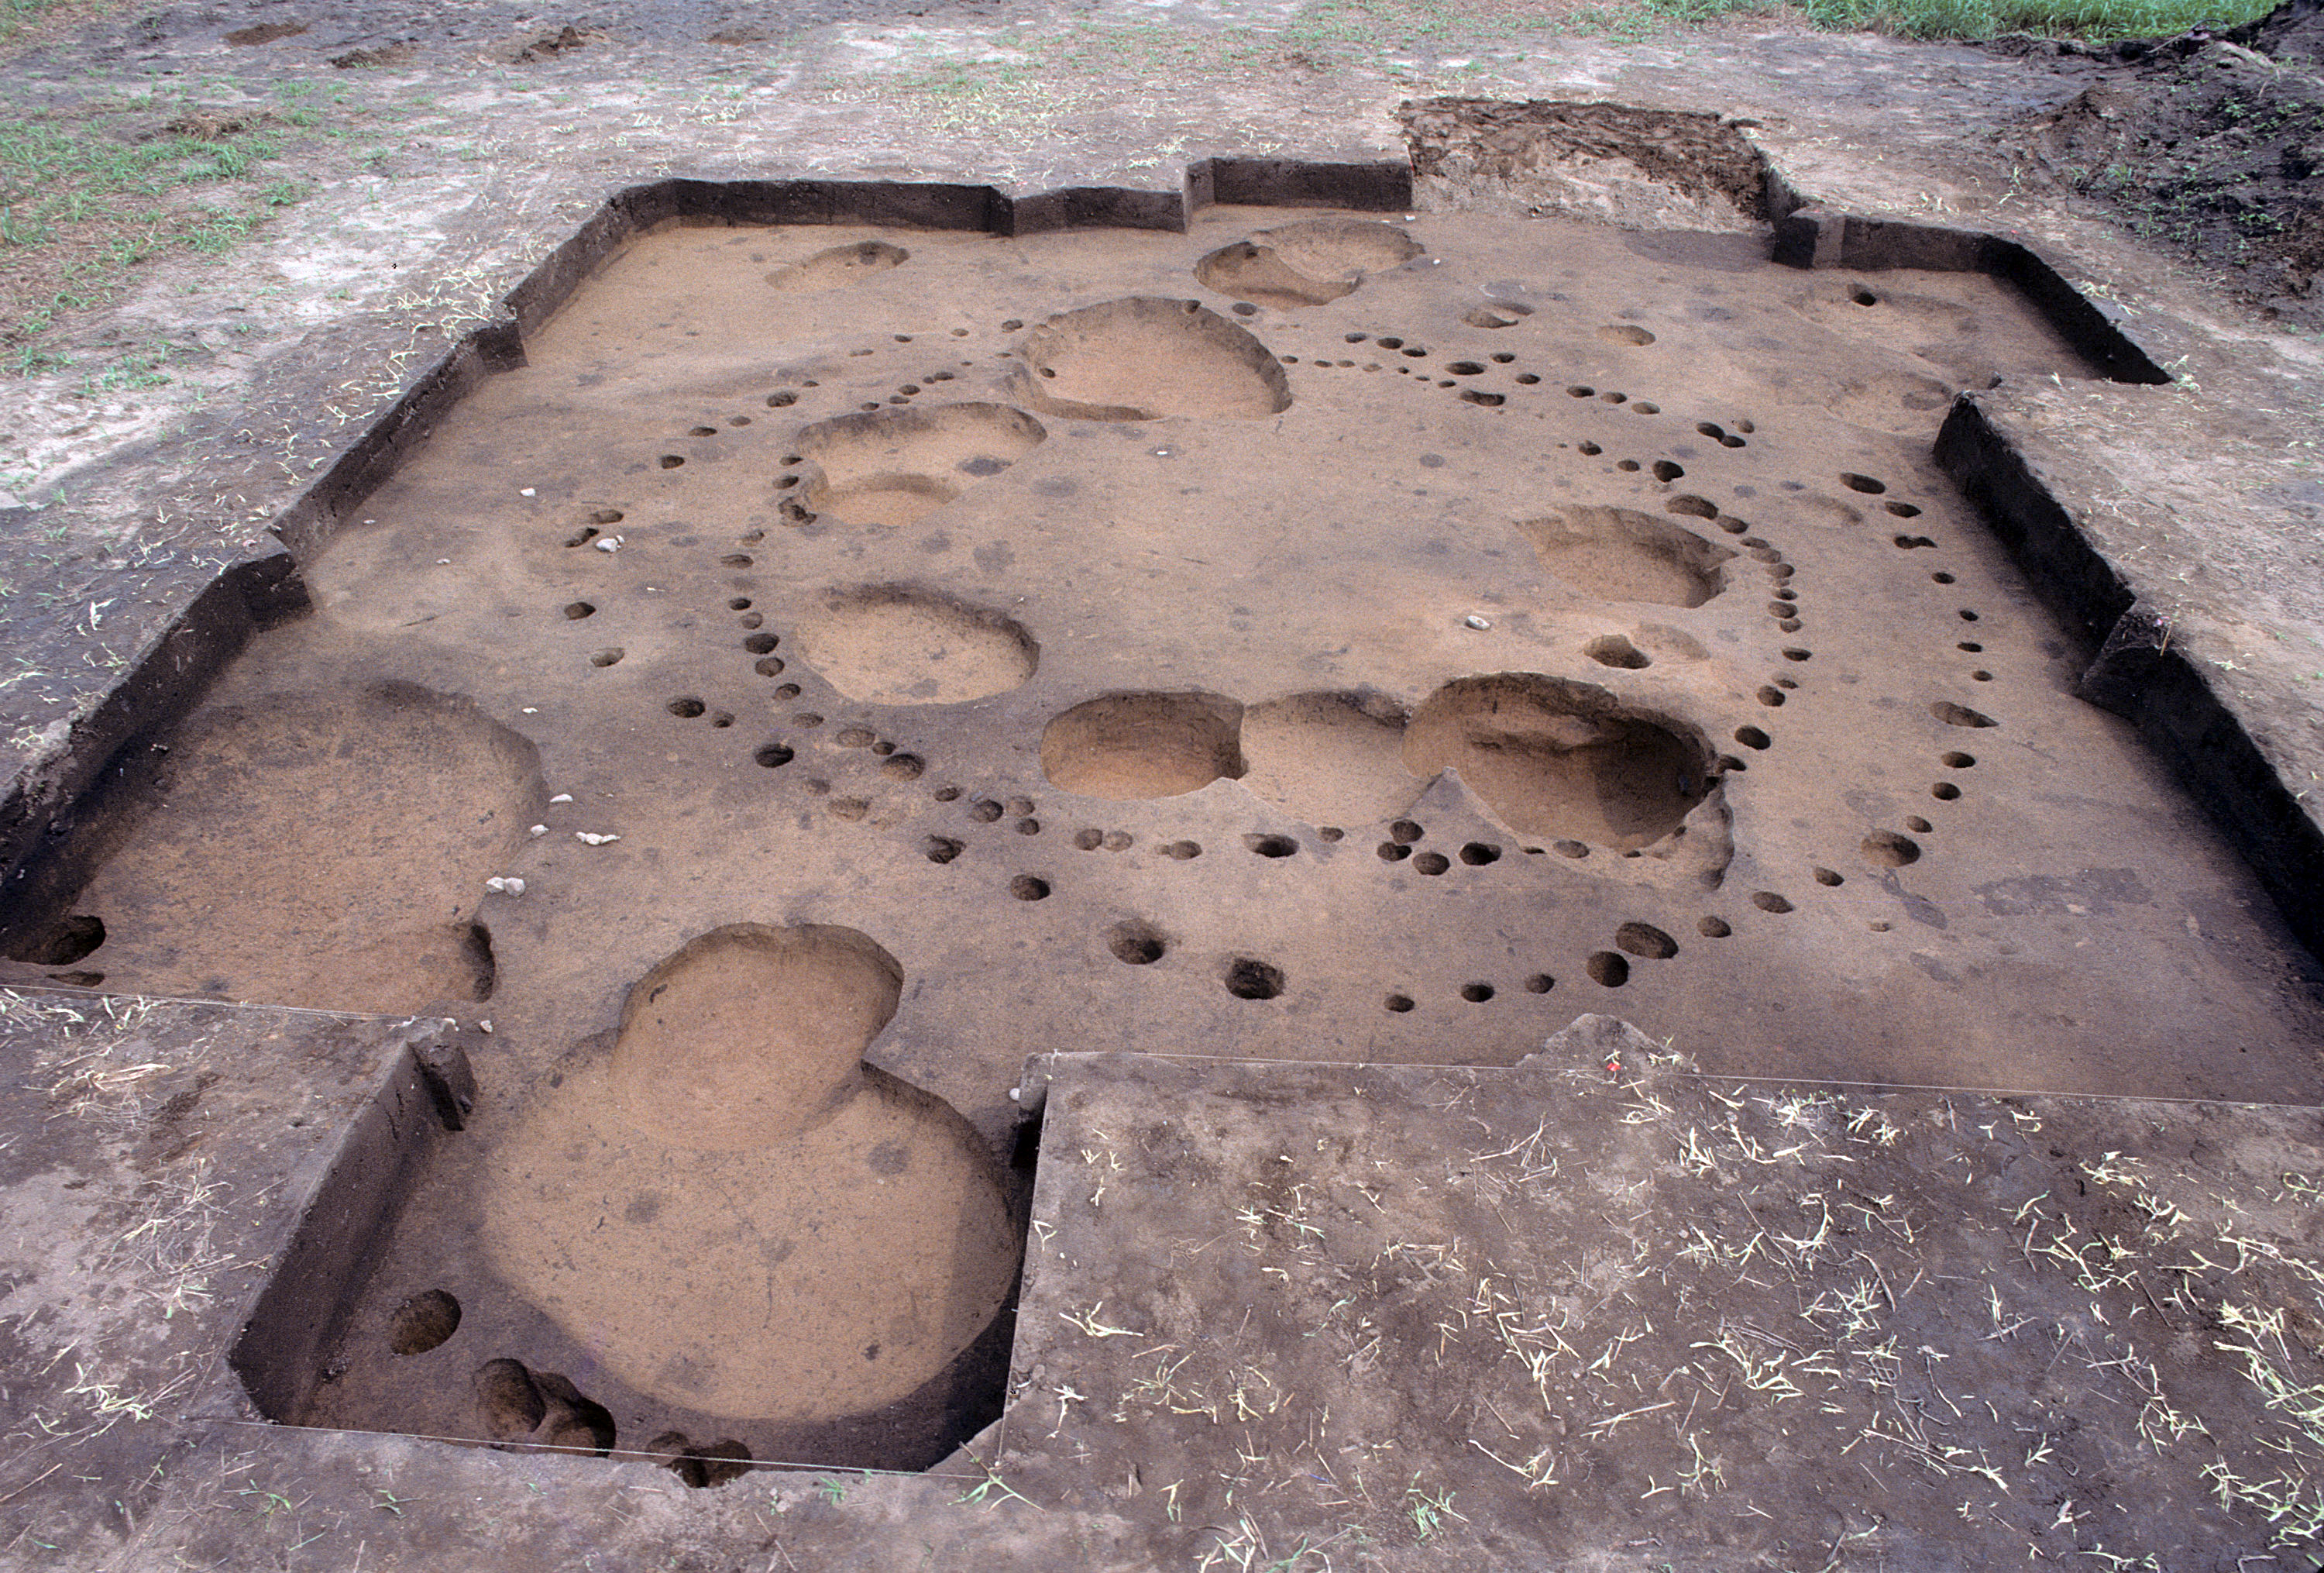
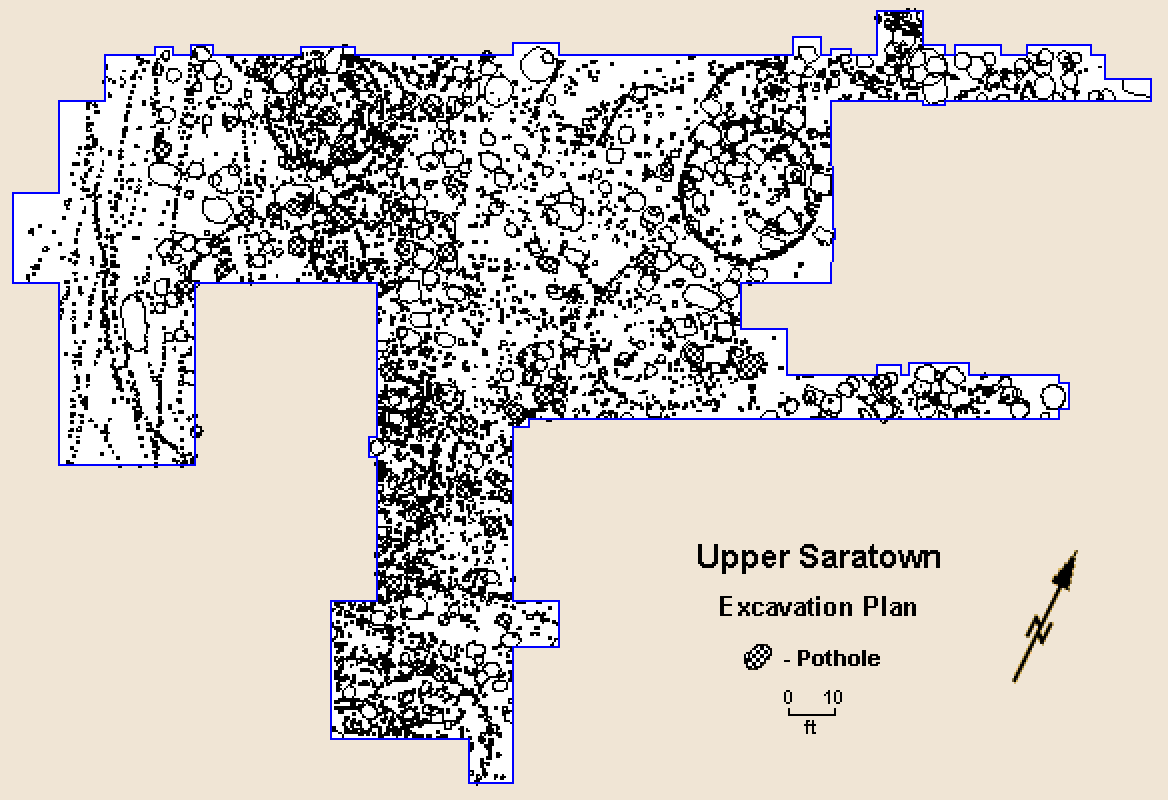
Figure 489. Excavation plan of Upper Saratown.
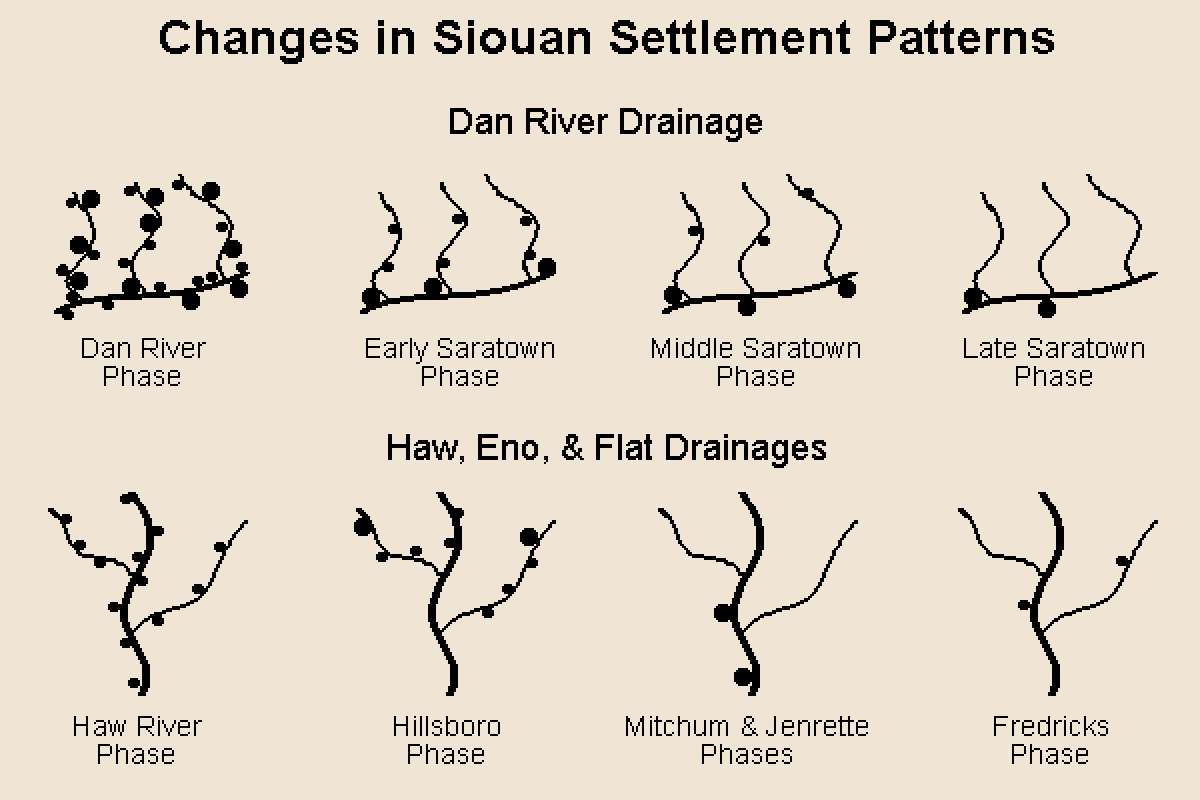
Figure 490. Model of Siouan settlement change.
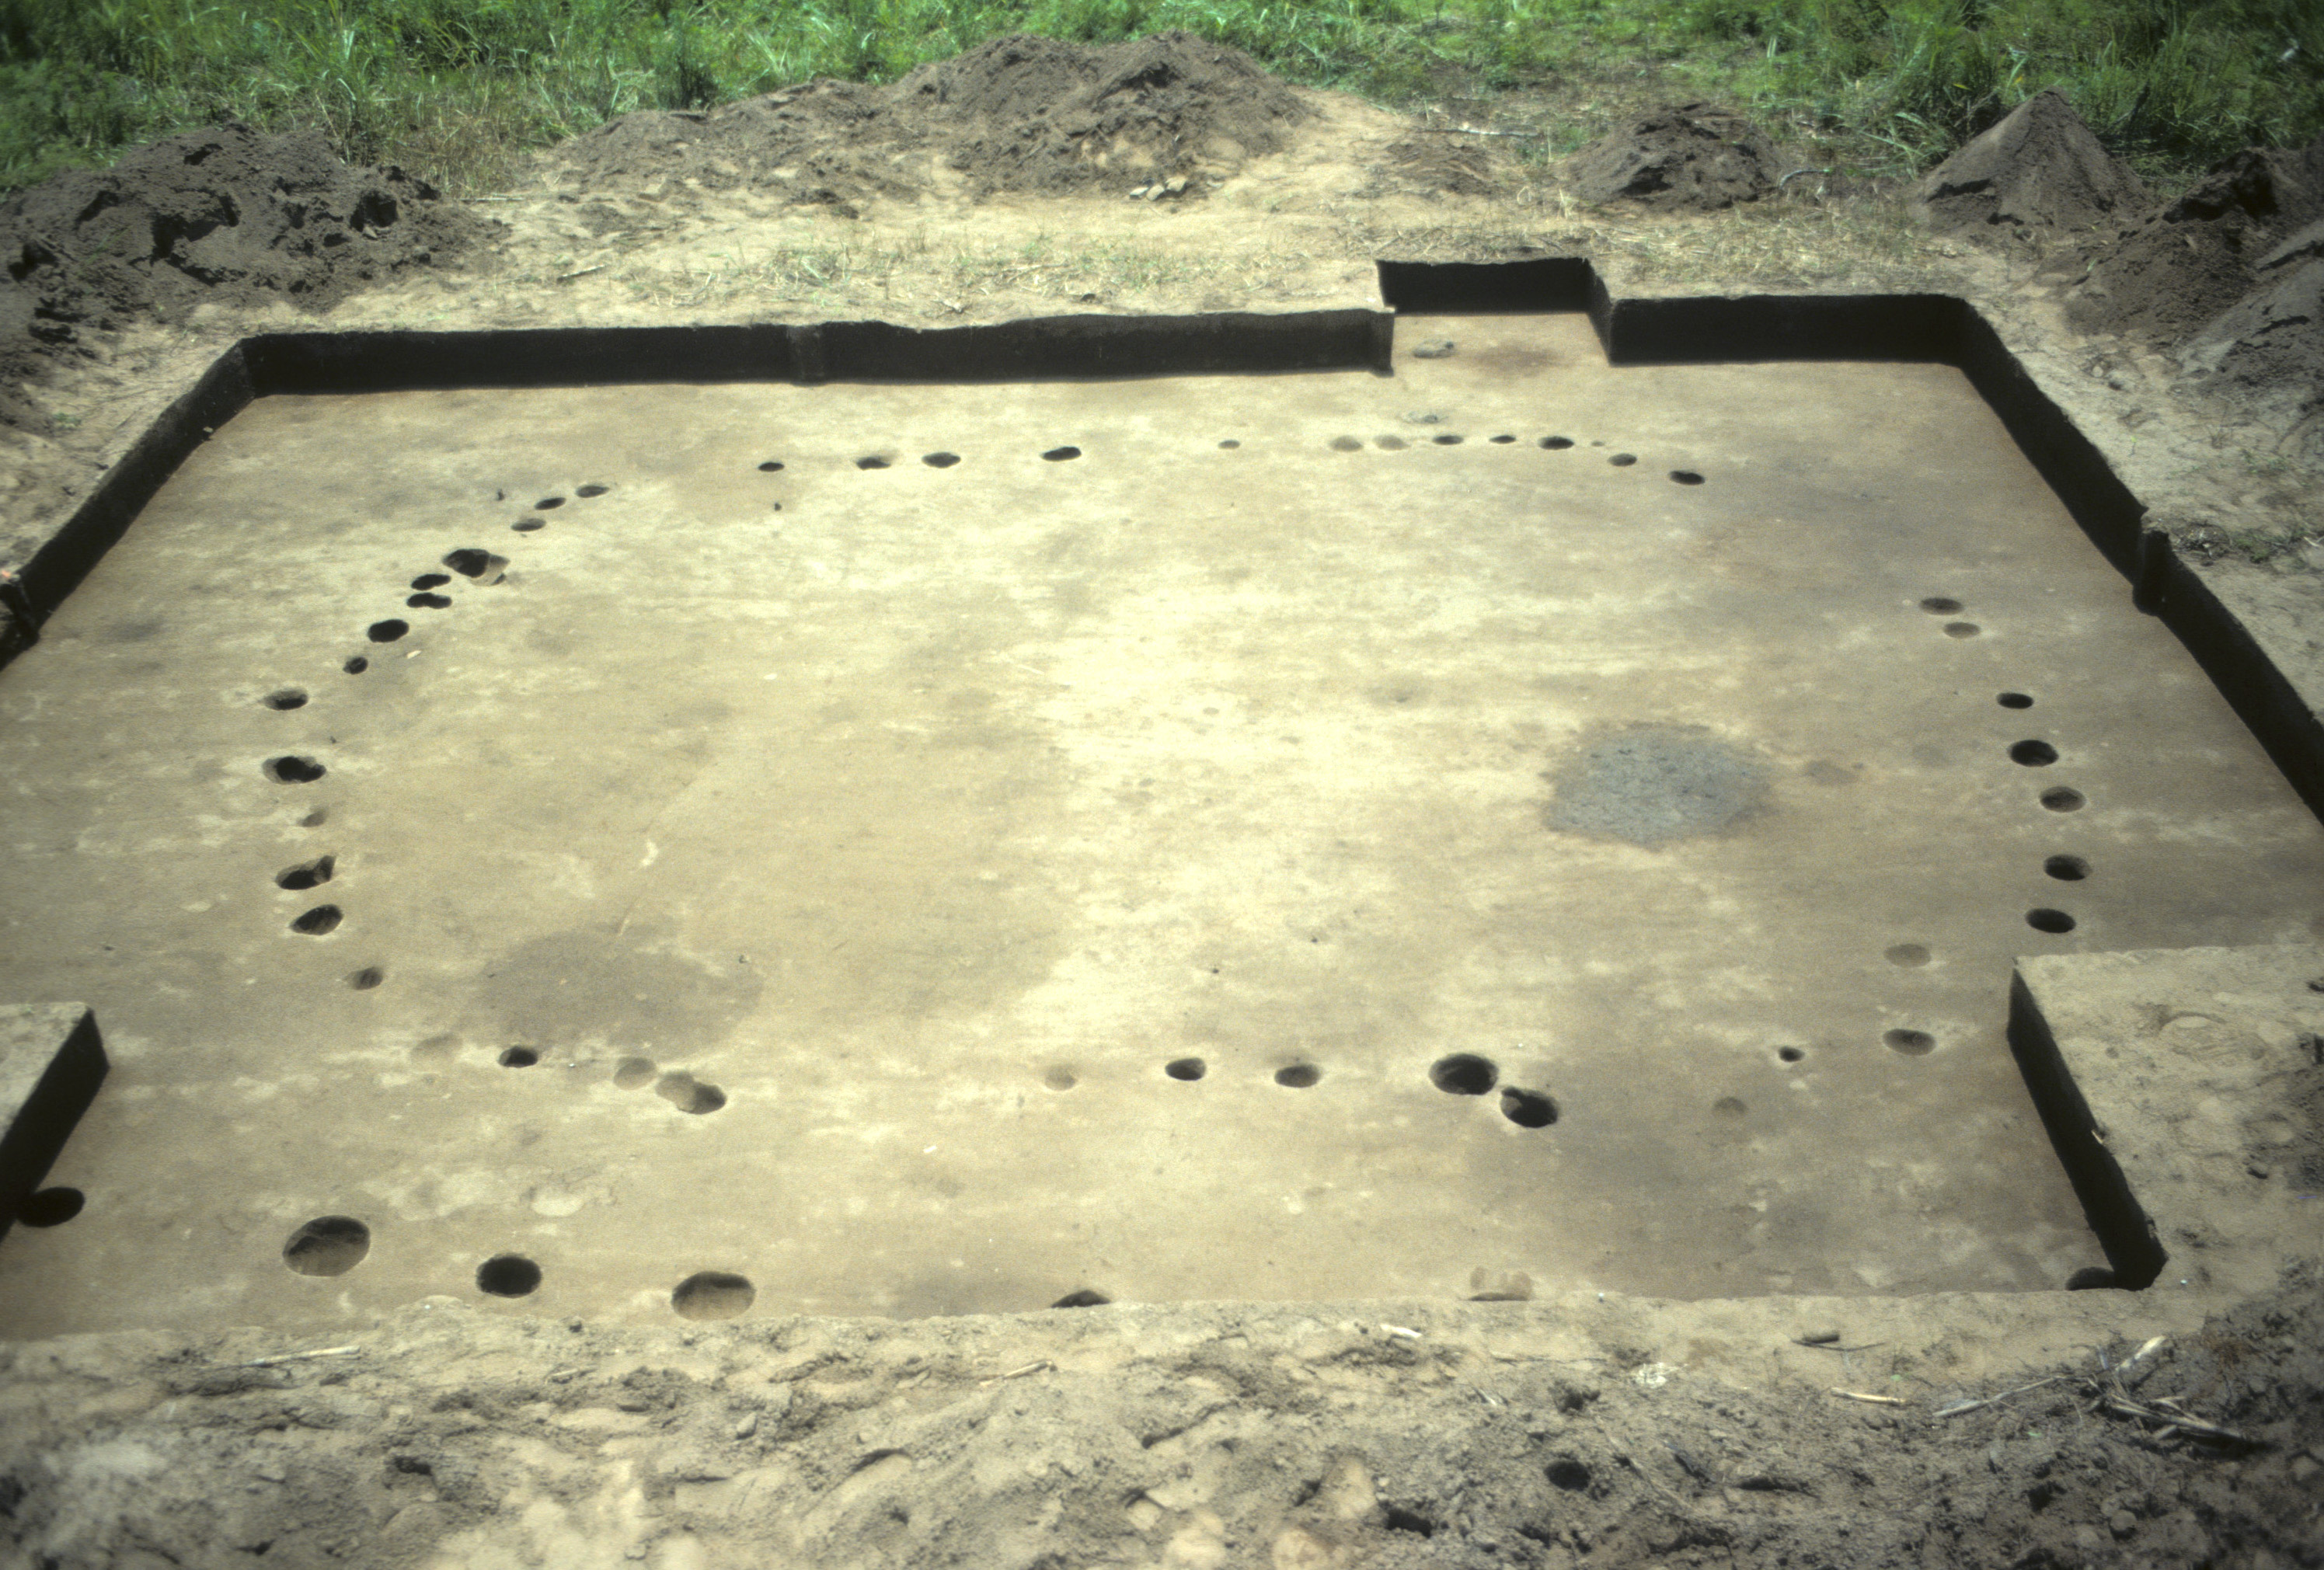
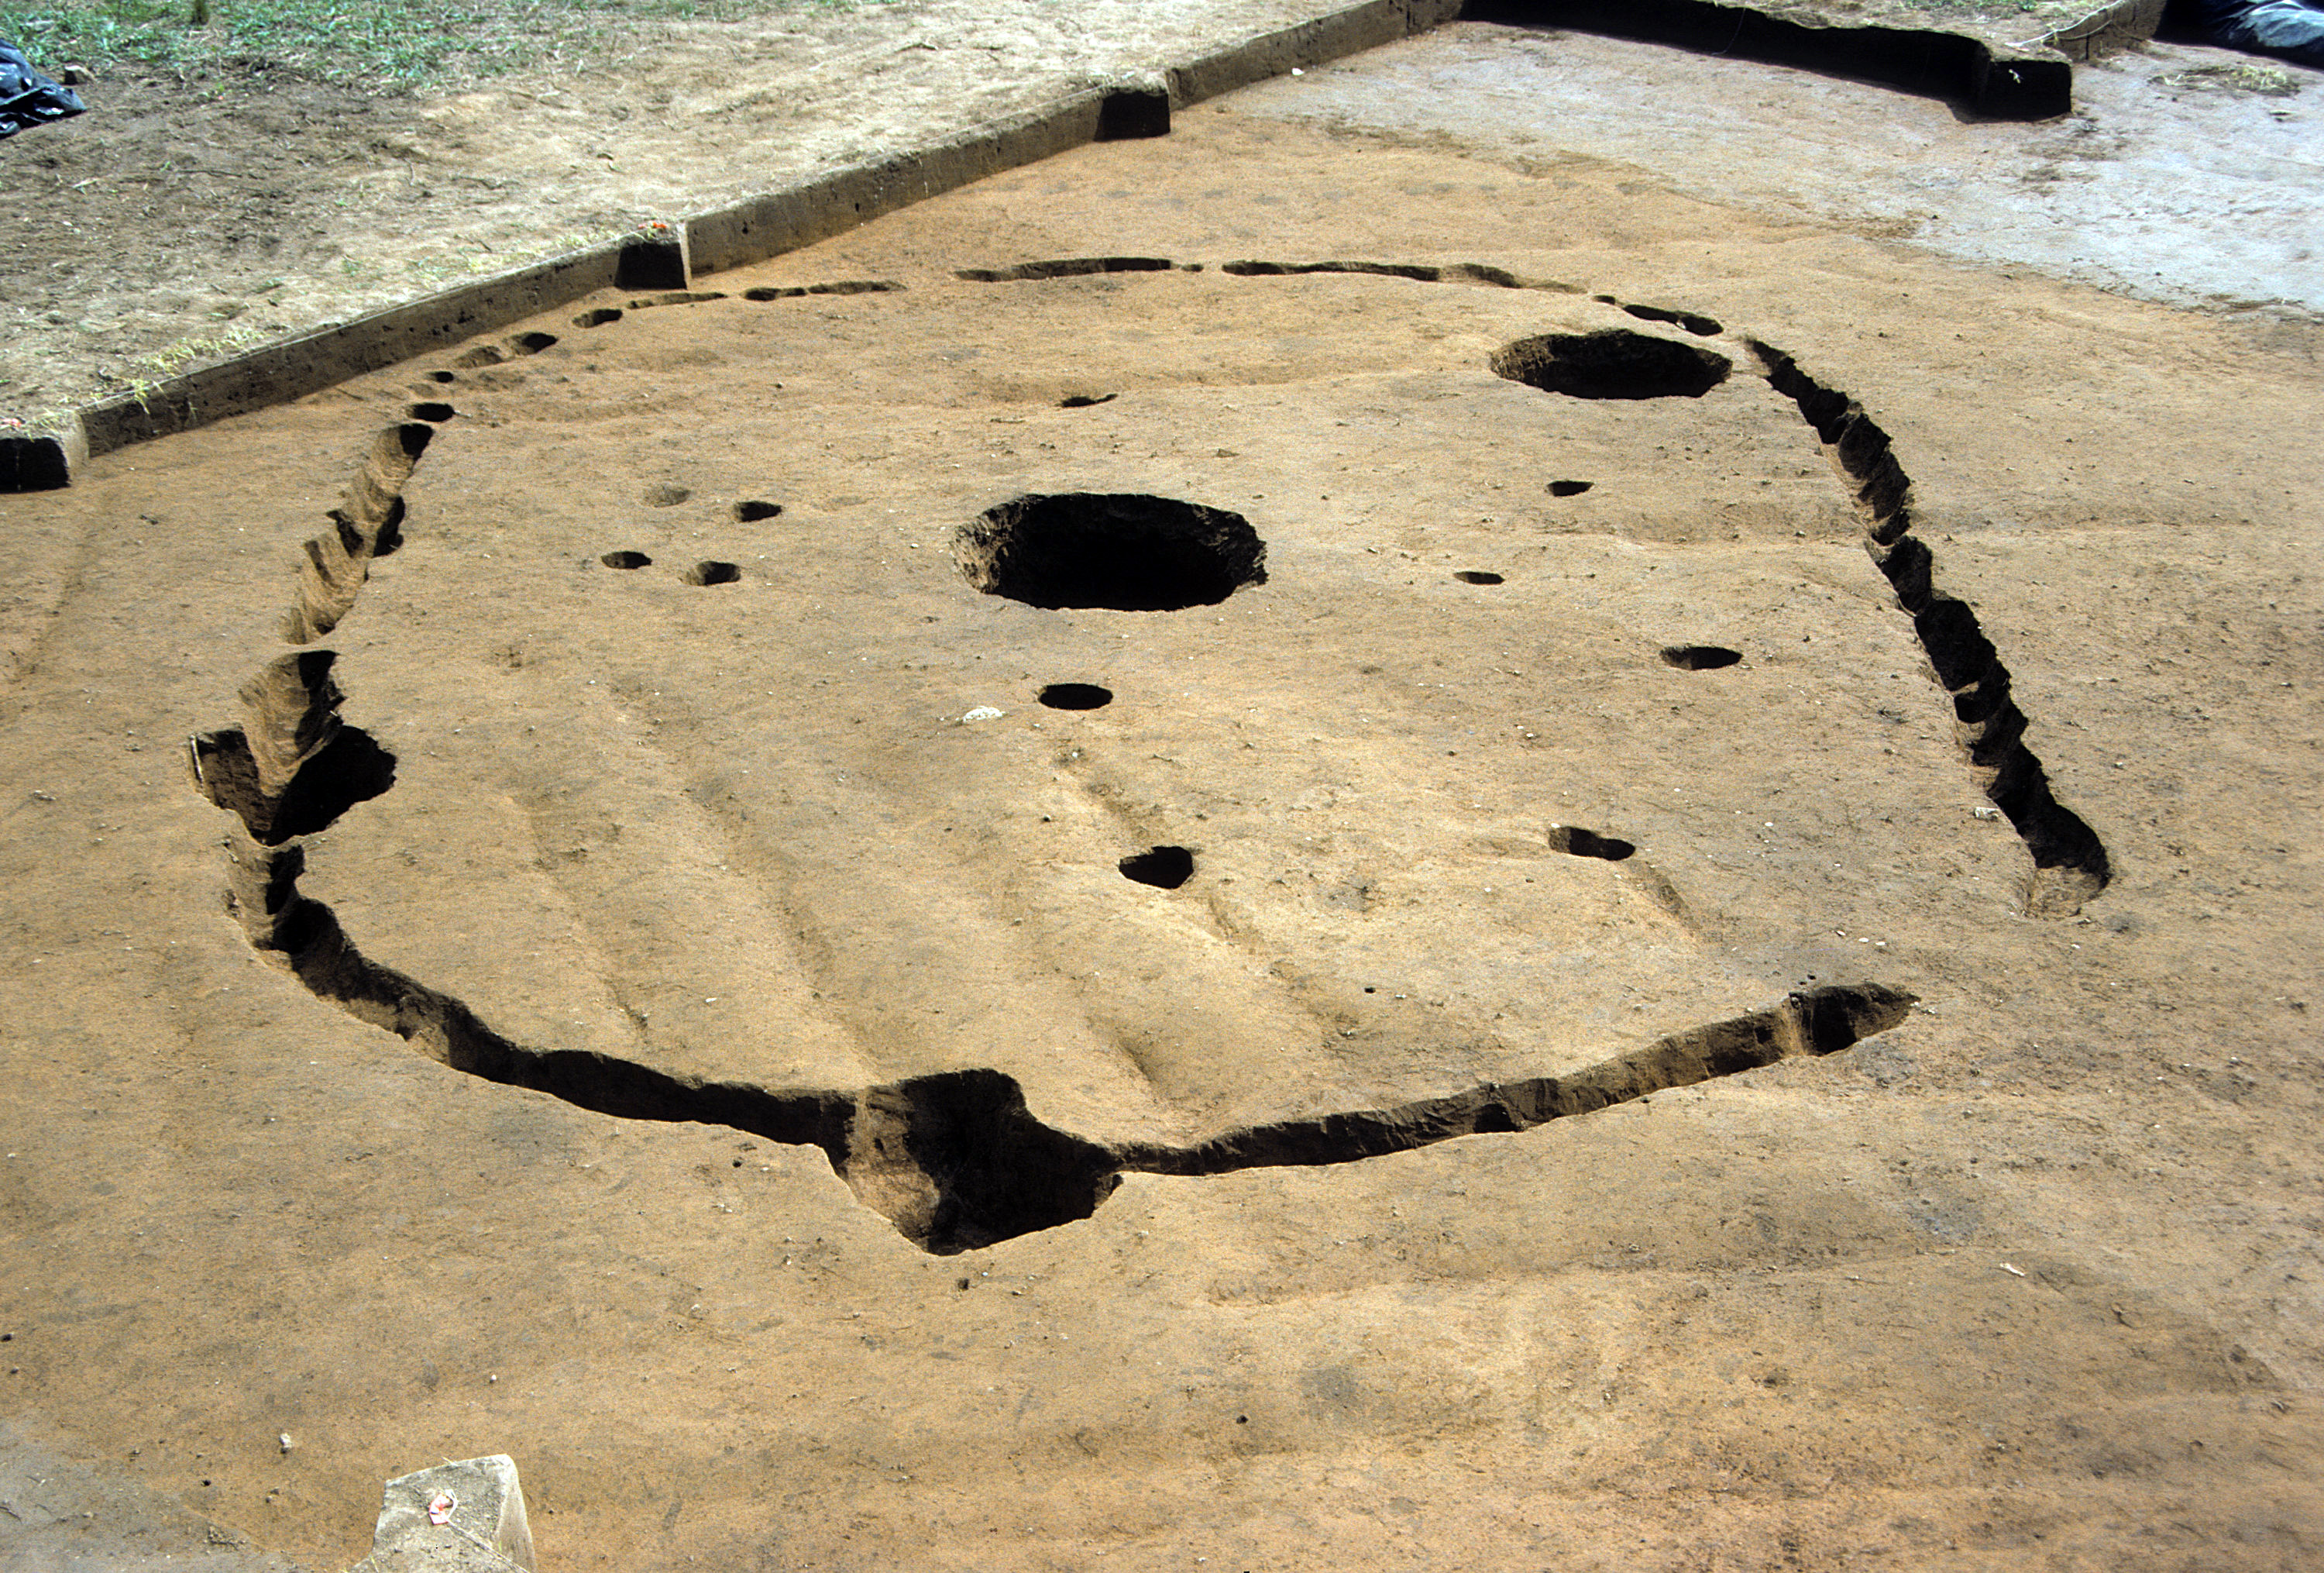
Figure 1054. Wall-trench house at the Jenrette site (interior floor area measures 16 ft by 19 ft).