

Tables
Table 18. Summary of plant remains from the Wall, Fredricks, and Mitchum sites (weights in grams).
Table 19. Percent of plant food remains from the Wall, Fredricks, and Mitchum sites.
Table 20. Ubiquity of plant remains, as percent of flotation samples at the Wall, Fredricks, and Mitchum sites.
Table 21. Seed counts from the Fredricks site.
Table 22. Seed counts from the Wall and Mitchum sites.
Table 23. Percent of nutshell from the Wall, Mitchum, and Fredricks sites.
Table 24. Comparison of plant remains from burials, features, and structures at the Fredricks site.
Table 25. Distribution of seeds from the Wall, Mitchum, and Fredricks sites (number per gram of plant food remains).
Figures: General
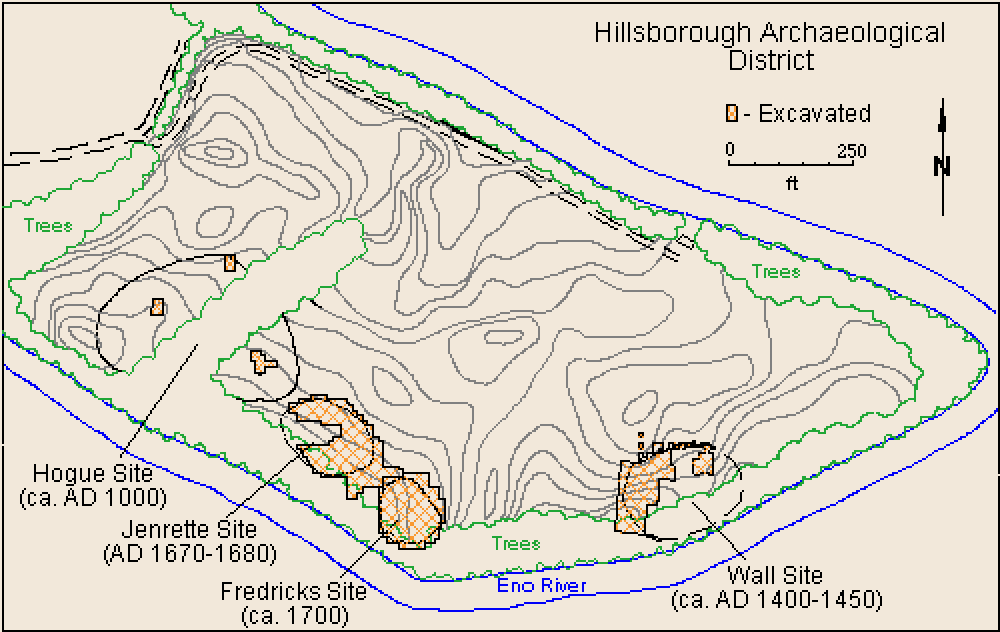
Figure 8. Excavated sites in the Hillsborough archaeological district.
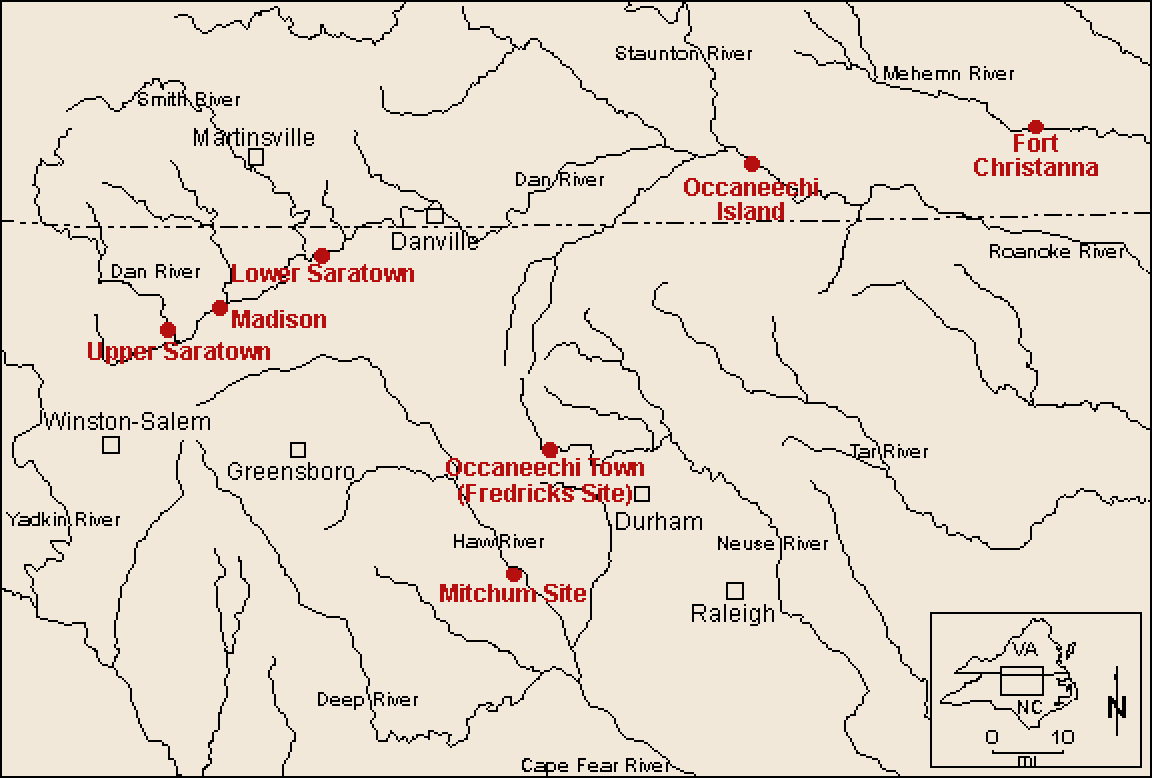
Figure 9. Selected archaeological sites in northern North Carolina and southern Virginia.
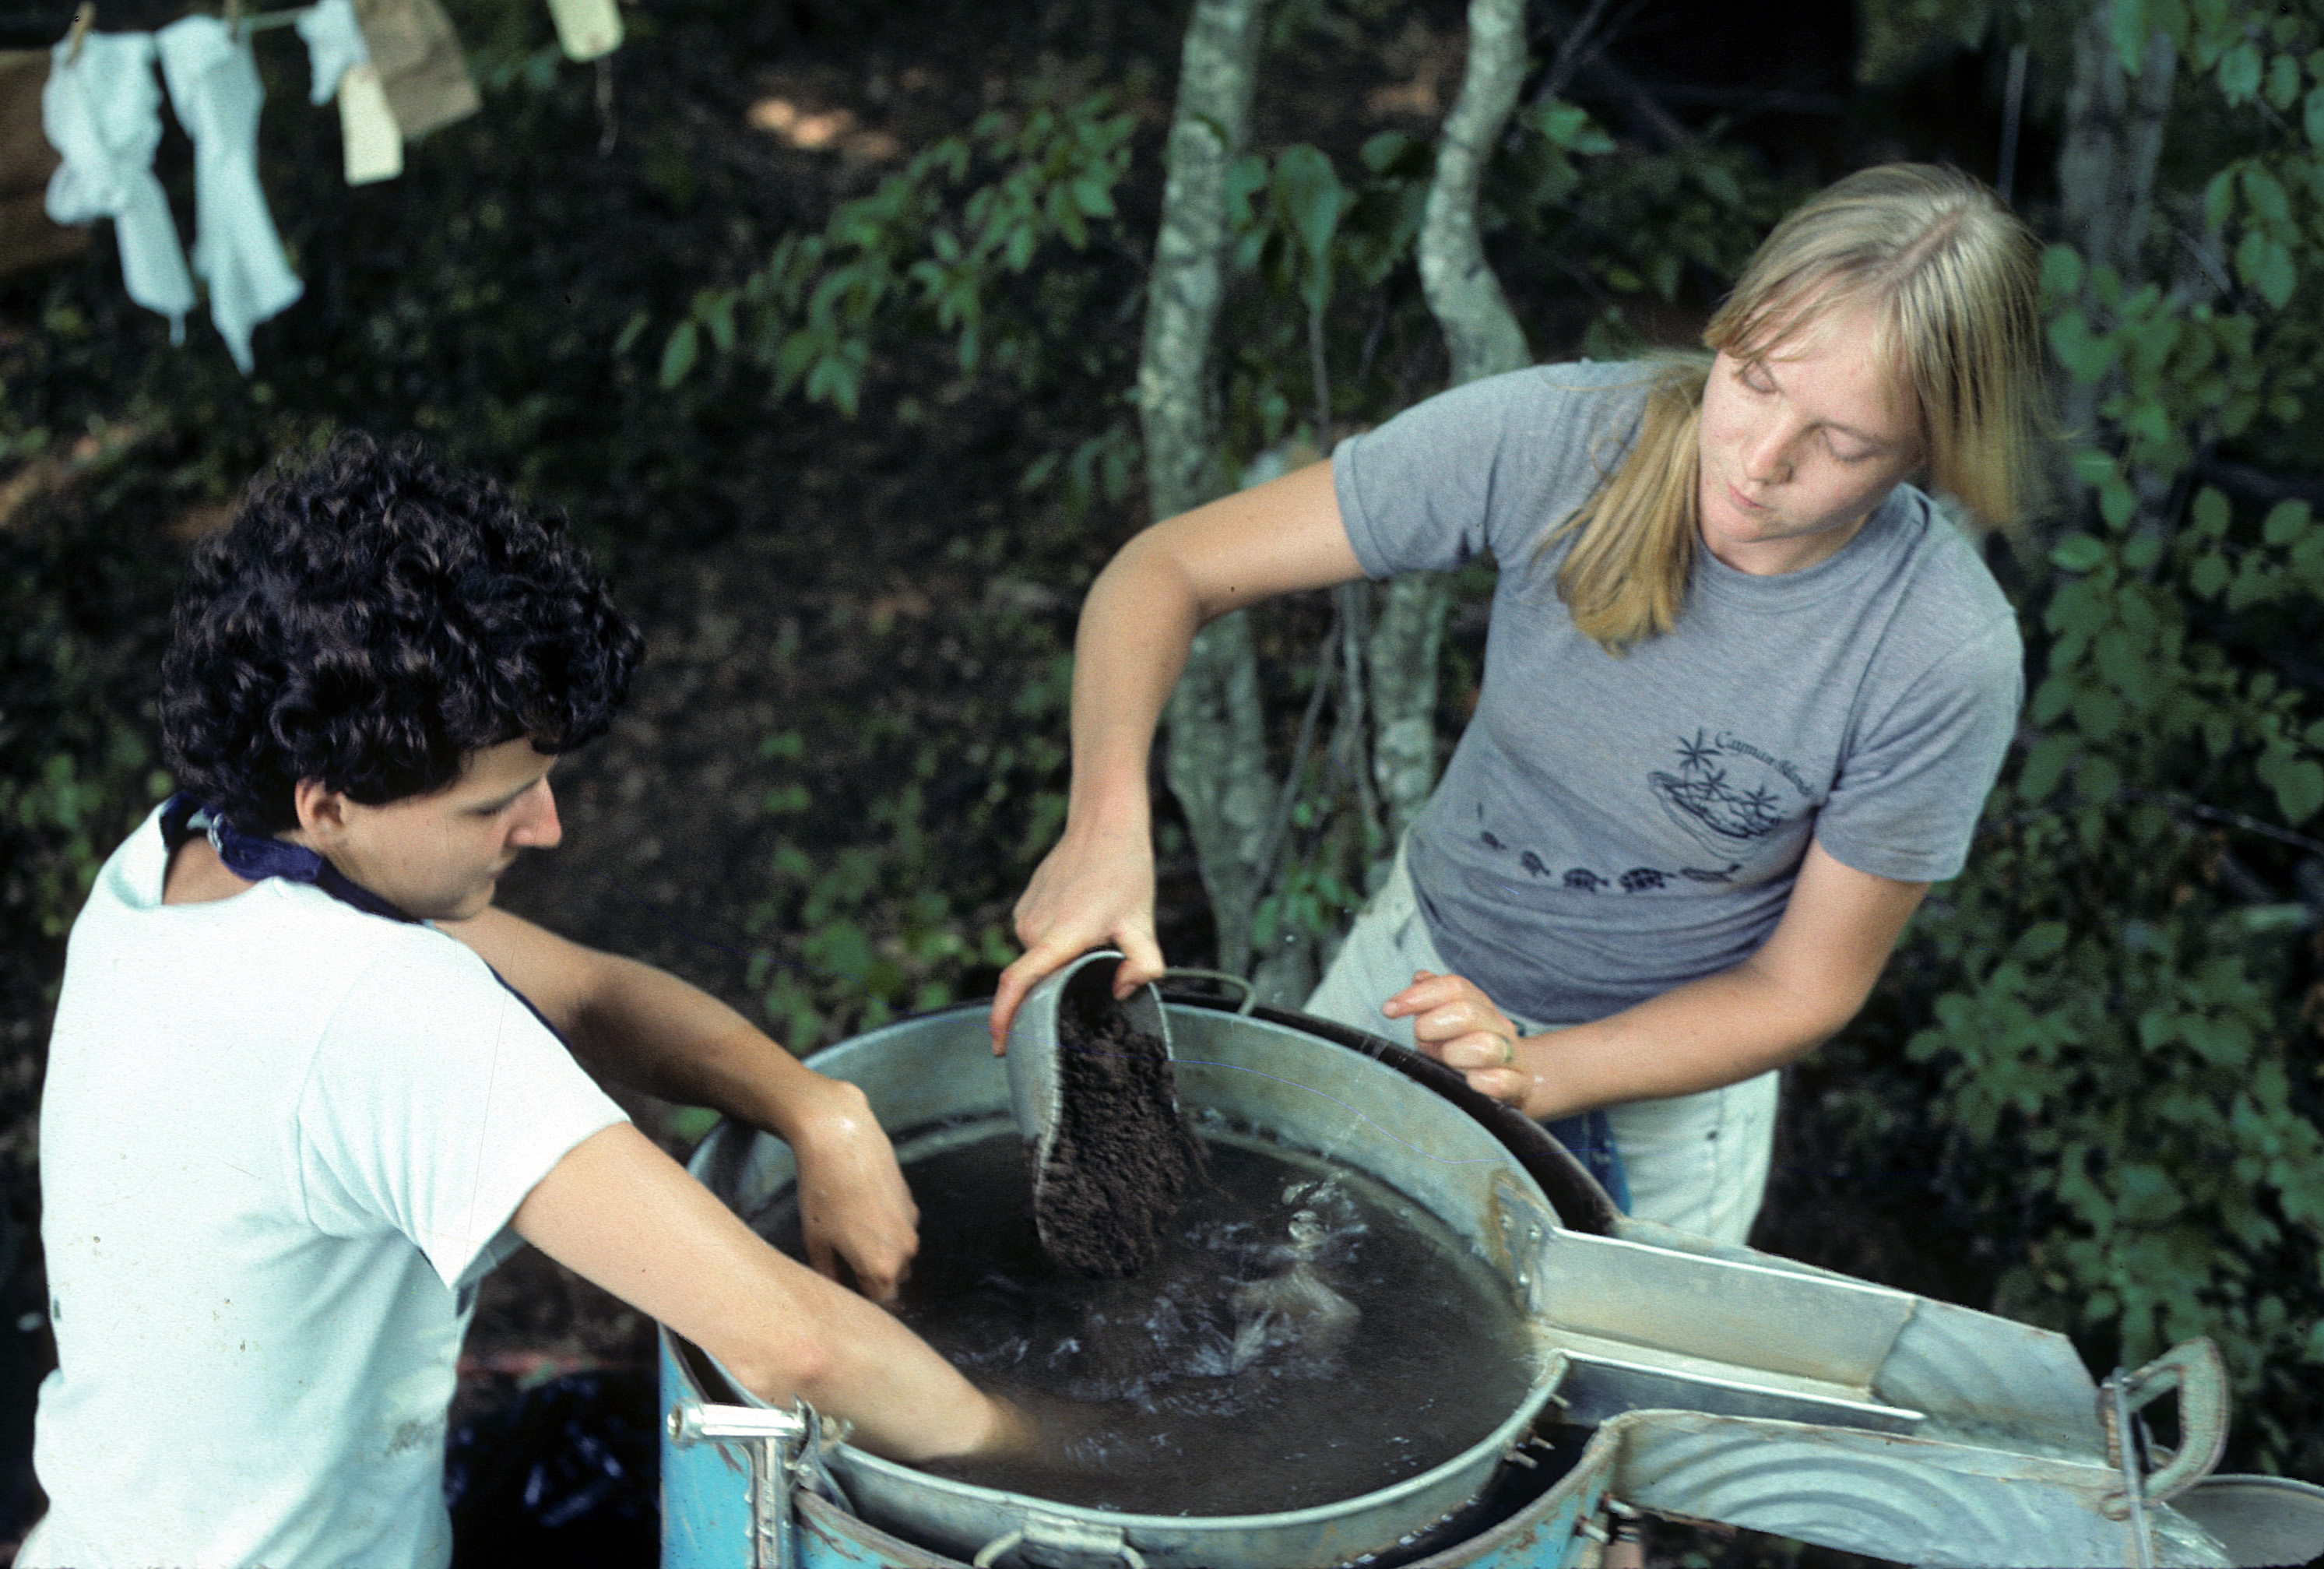
Figure 37. Students using a flotation tank to retrieve carbonized plant remains.